

Guideline for MAW4
1. Introduction
This document is intended to assist prospective Smile clients in evaluating the outcomes of the back-testing. Clients can decide whether to use Smile's data into their credit assessment procedures by being aware of important evaluation criteria and the technique underlying them. To facilitate confident data-driven decision-making, this handbook simplifies the fundamental ideas in an understandable and useful way.
2. Data Characteristics
Smile provides loan-level credit history attributes, reflecting borrower behavior across:
- Multiple loans
- Multiple lenders
These attributes capture behavioral patterns rather than single-event risk signals.
3. IV Considerations
Univariate Information Value (IV) is effective for screening standalone variables. However, for bureau-like enrichment data:
- Individual attributes may exhibit low IV due to correlation with existing bureau variables
- Predictive value typically emerges at the model or segment level
- Low IV does not imply lack of incremental risk separation
Therefore, IV alone is not sufficient to assess the contribution of this data type.
4. Evaluating Results
4.1 Hit Rate
Definition:
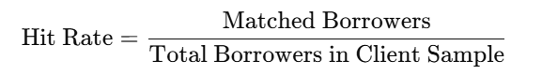
The hit rate of a client's borrowers for whom Smile was able to obtain at least one matching credit record from its database—including information from both Full Response and Summary Block—is known as the hit rate.
Formula:
Interpretation Example:
The hit rate is 60% if a client has 10,000 loans and 6,000 of them match Smile's data. This implies that risk signals for 60% of the portfolio can be assessed.
4.2 Gini Coefficient
Definition:
A chosen variable or raw derived indicator's discriminatory power is measured by the Gini coefficient. Both single variables and combinations of variables can be used to calculate Gini.
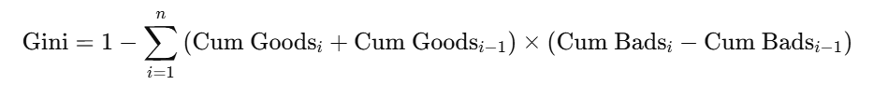
Formula:
To compute the Gini coefficient using cumulative distributions:
-
Divide the data into bins (e.g., deciles) sorted by increasing risk.
-
For each bin, calculate cumulative % of the good and the bad borrowers.
-
Apply this formula:
Interpretation:
It's crucial to remember that different markets may interpret Gini coefficient values differently. The thresholds shown here are unique to the Philippines setting and represent the usual range of predictive power seen in regional credit risk factors. Please be aware that these thresholds only apply to individual variables. A risk model or risk score would have different thresholds.
- 0–5%: Low predictive power
- 5–15%: Medium predictive power
- 15% and above: High predictive power
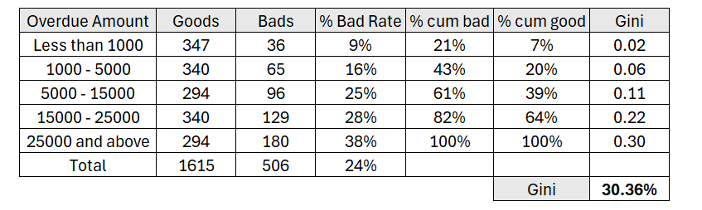
Example (for single variable):
When its predictive power is assessed, the variable Overdue Amount can be a powerful indicator of credit risk. You can compare the proportion of good and bad borrowers by grouping borrowers according to the total amount of past-due payments they currently owe. The Overdue Amount variable would have strong discriminatory power, as indicated by a higher Gini coefficient, if borrowers with higher overdue amounts consistently demonstrate a higher likelihood of default.
Repayment History (credits with three or more missed installments would be considered high risk), Status Code (we anticipate that credits in status Delayed, Collection, and Written off would have higher risk), etc. are additional powerful predictors.
Example of Gini calculation for score:
The Gini coefficient of a scoring model constructed with several input variables can be evaluated using the same technique. The Gini, which measures the model's overall discriminatory power, can be computed based on the model's predicted scores rather than assessing a single variable:
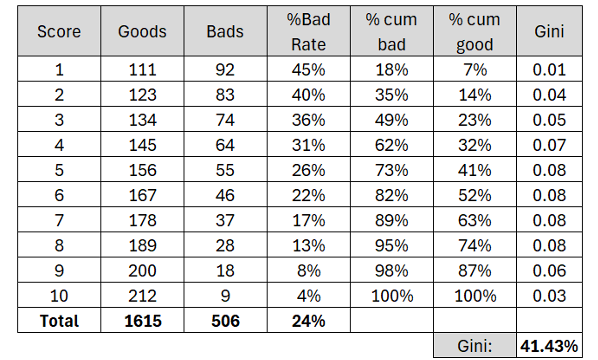
This approach is useful when combining multiple sources of predictive information—such as integrating a score derived from our data with an existing internal score. The resulting Gini coefficient reflects the overall predictive power of the combined score and helps quantify the improvement it provides compared to relying on the internal score.
5. Recommended Validation Methods
5.1 Overlay (Challenger) Model
- Existing approved model remains unchanged
- Build a challenger model using:
- Existing model score combined with
- Smile features
- Evaluate incremental performance using:
- Δ GINI / KS
- Bad rate at constant approval rate
Purpose: Measure incremental lift without modifying current risk logic.
5.2 Risk Segmentation
- Select an approved population or narrow score band
- Use Smile data to stratify applicants into multiple risk segments
- Evaluate:
- Bad rate monotonicity
- Risk separation between segments
Purpose: Demonstrate portfolio-level risk differentiation without decision impact.
5.3 Live POC
- Smile runs in parallel with production decisions
- No influence on approvals or declines
- Post-observation analysis compares outcomes across Smile risk signals
Purpose: Validate performance on live data with zero operational or credit risk.
6. Evaluation Metrics
Recommended metrics:
- ΔGINI / KS
- Bad rate reduction at constant approval
- Approval uplift at constant bad rate
- Segment-level risk separation
Updated about 2 months ago